Web UI Guide
The local browser dashboard, panel by panel.
The web UI (farsight web, FastAPI + Uvicorn, farsight/web/app.py) wraps the exact same scan modules as the CLI behind a live-progress browser view. It’s local-only and unauthenticated by design — intended for a presenter running it on their own machine, not for exposing to a network. See Architecture for how its orchestrator relates to the CLI’s scan pipeline.
Starting a scan
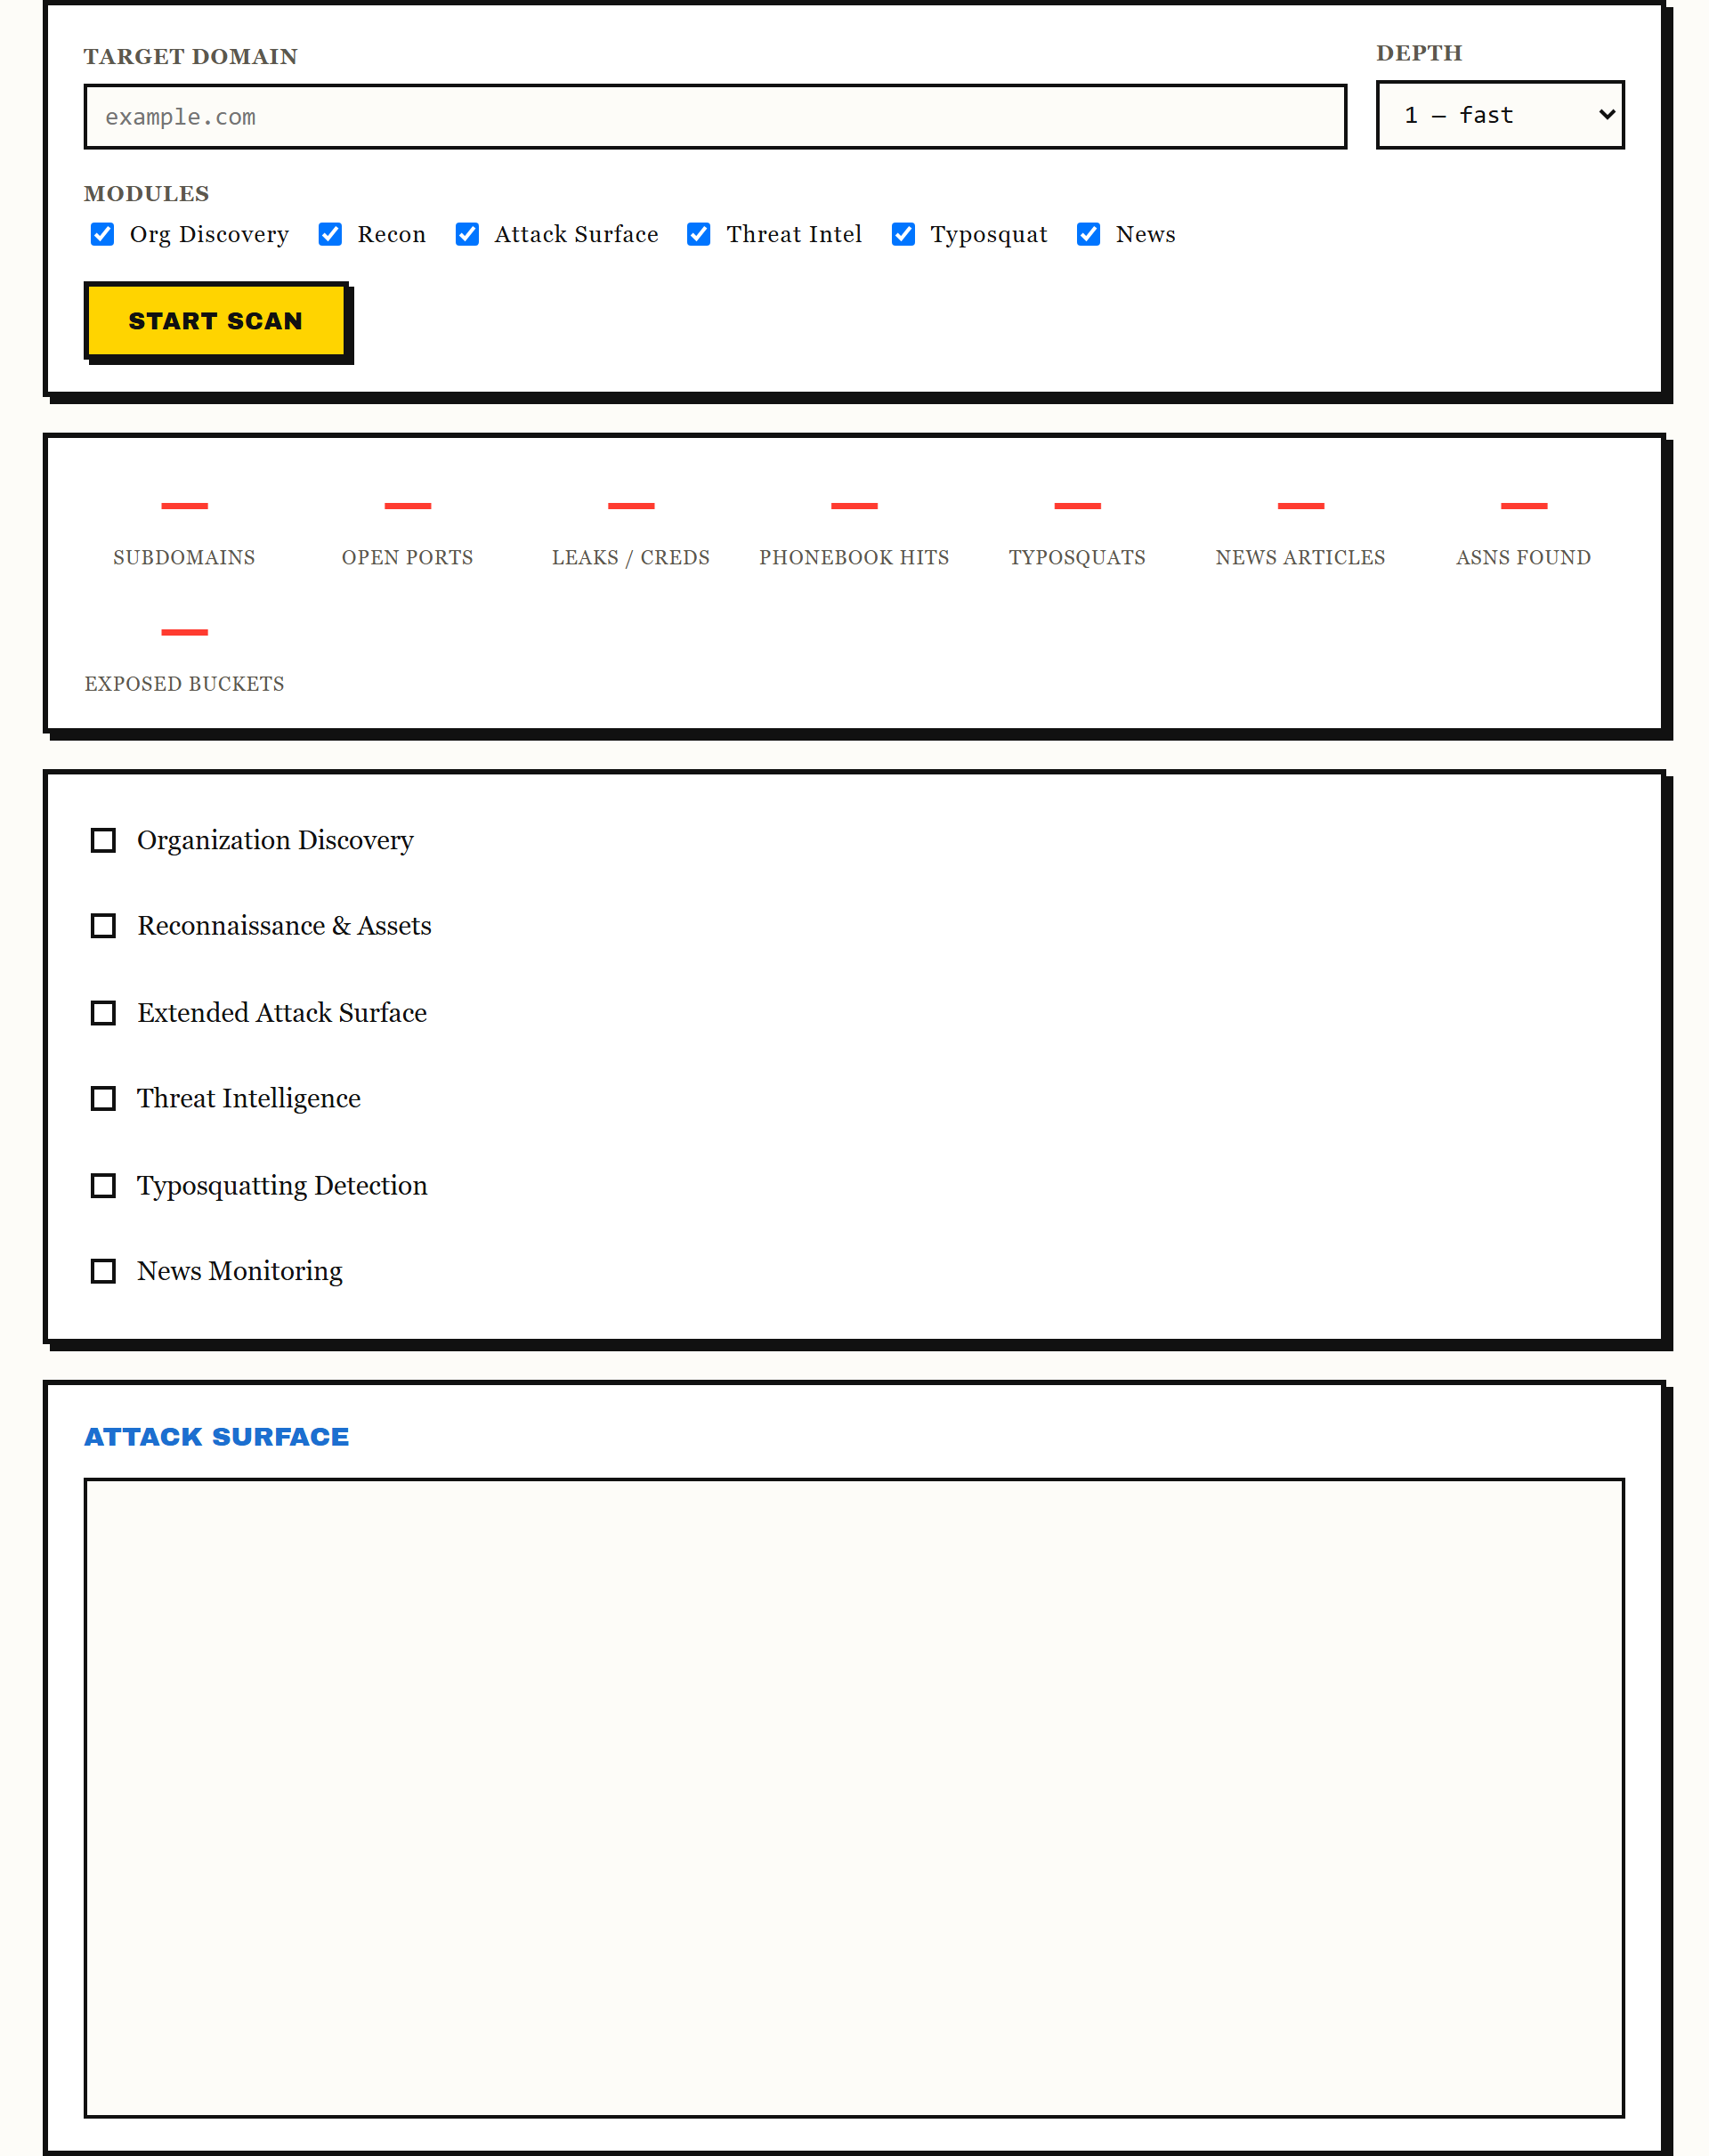
The form lets you pick a target domain, scan depth, and which of the six modules to run — all checked by default. Submitting opens a WebSocket connection to /ws that streams the entire scan as a sequence of typed events (farsight/web/events.py):
| Event | Meaning |
|---|---|
scan_started |
The scan has begun |
module_started |
A specific module has begun |
module_completed |
A module finished; carries a frontend-friendly summary payload for that module |
module_error |
A module failed — the scan continues to the next module rather than aborting (see Architecture) |
report_ready |
The Markdown/PDF report has been generated; carries the report ID |
scan_completed |
The whole scan finished |
scan_rejected |
The request was refused — either no domain was given, or another scan is already running (only one scan runs at a time; see Architecture) |
scan_failed |
An unrecoverable error occurred |
Live progress and stats
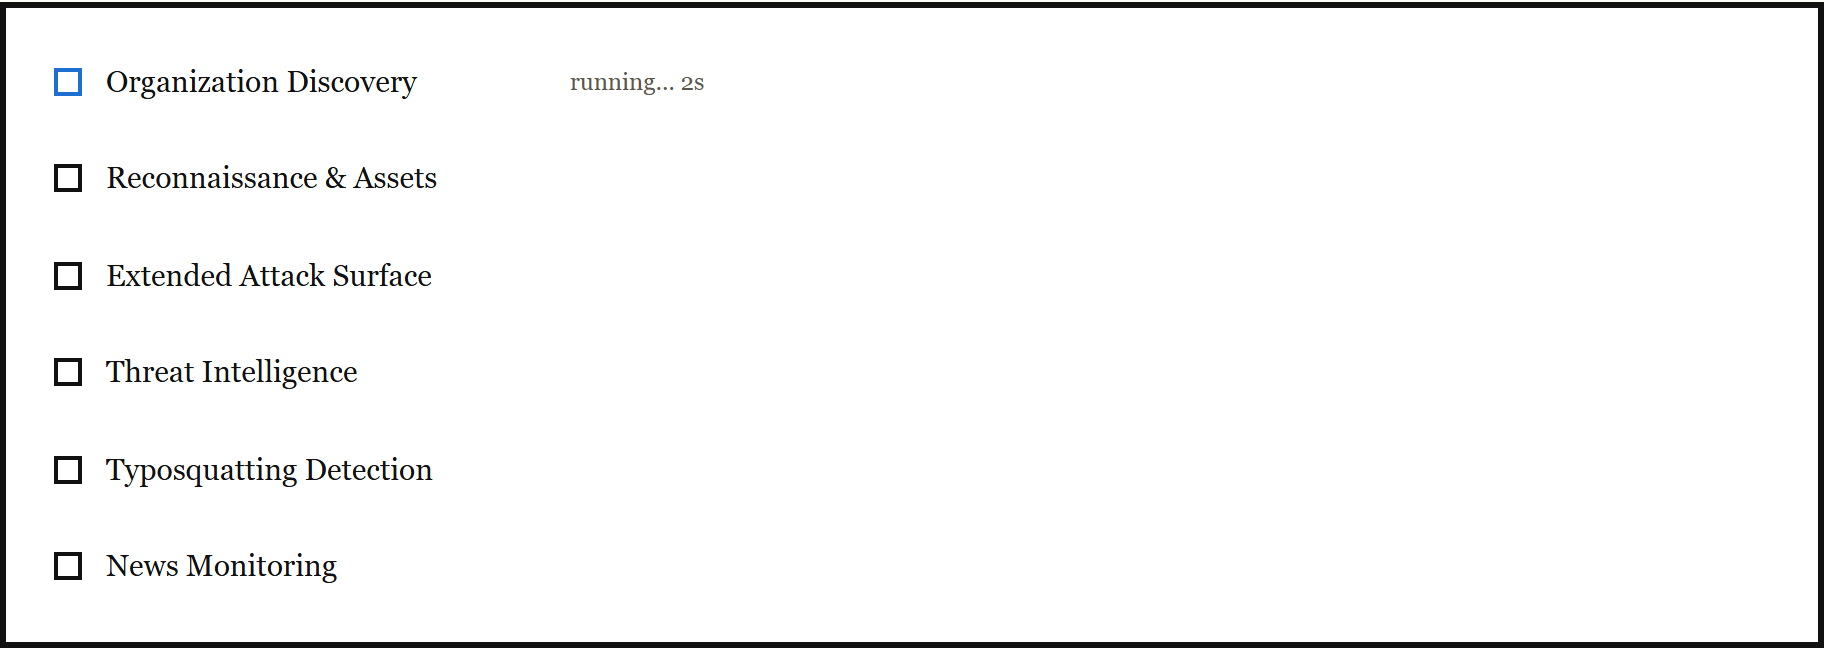

As module_completed events arrive, the module list updates in place and the stat tiles (subdomains, open ports, leaks/creds, phonebook hits, typosquats, news articles, ASNs found, exposed buckets) tick up live — there’s no need to wait for the whole scan to finish to see what’s turning up.
Attack surface graph
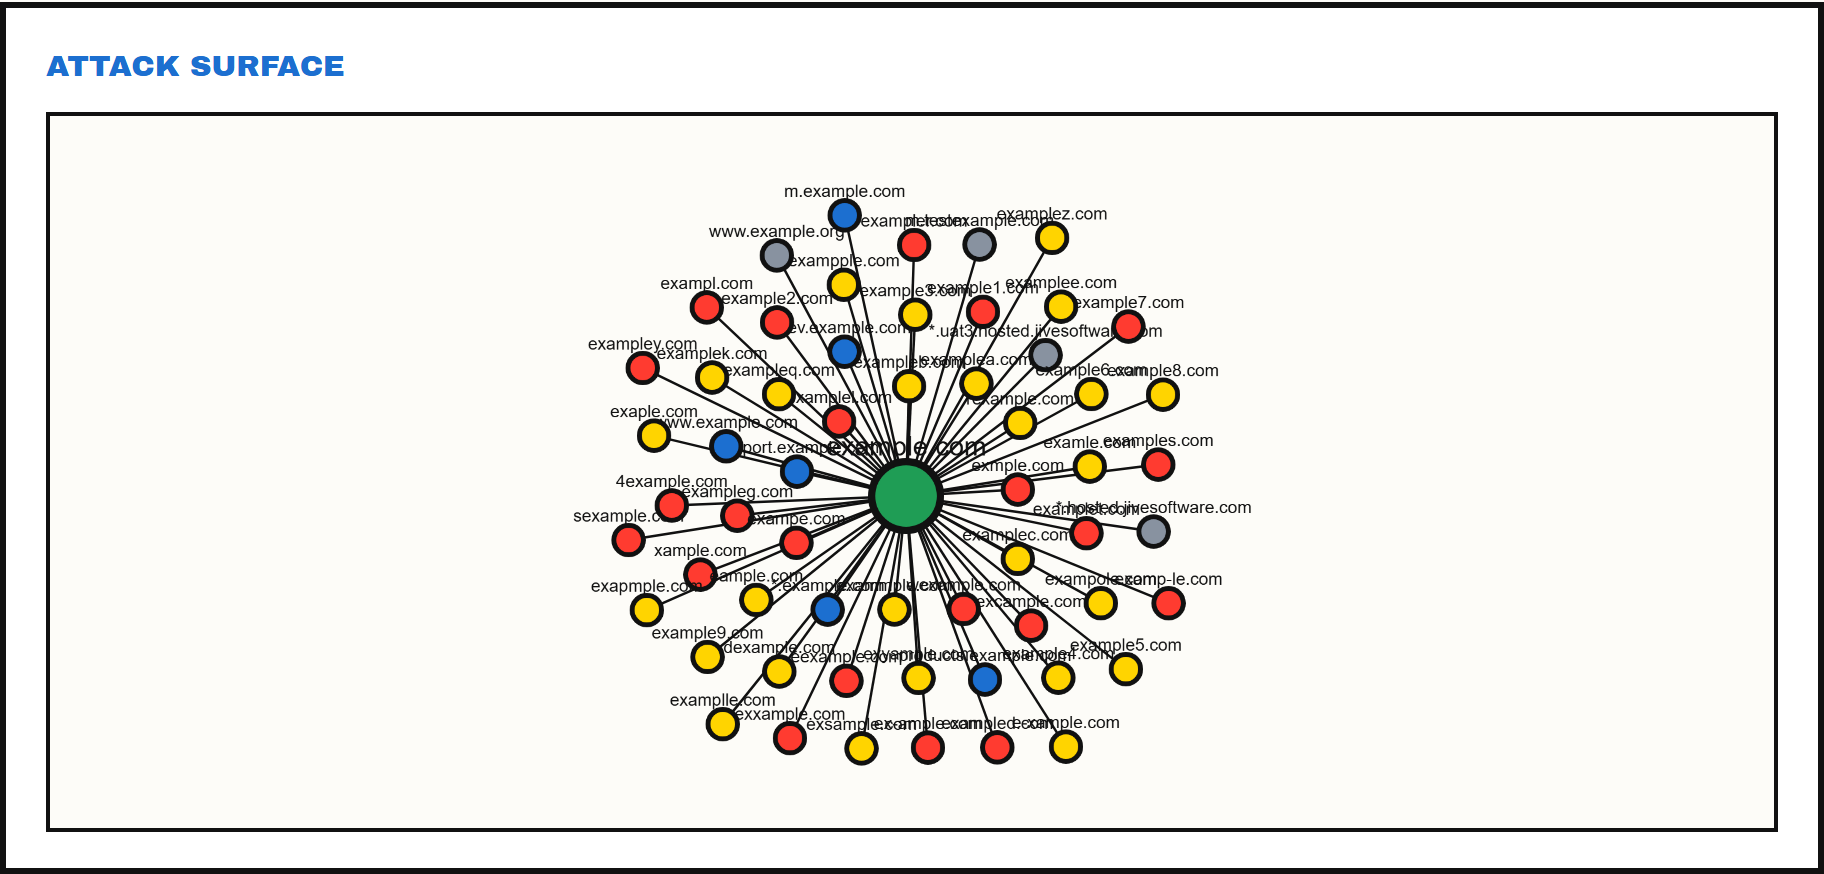
A Cytoscape.js graph (vendored locally at farsight/web/static/js/vendor/cytoscape.min.js, plus js/graph.js) centers the target domain and radiates out to every subdomain and typosquat candidate discovered, color-coded by category.
Extended attack surface detail
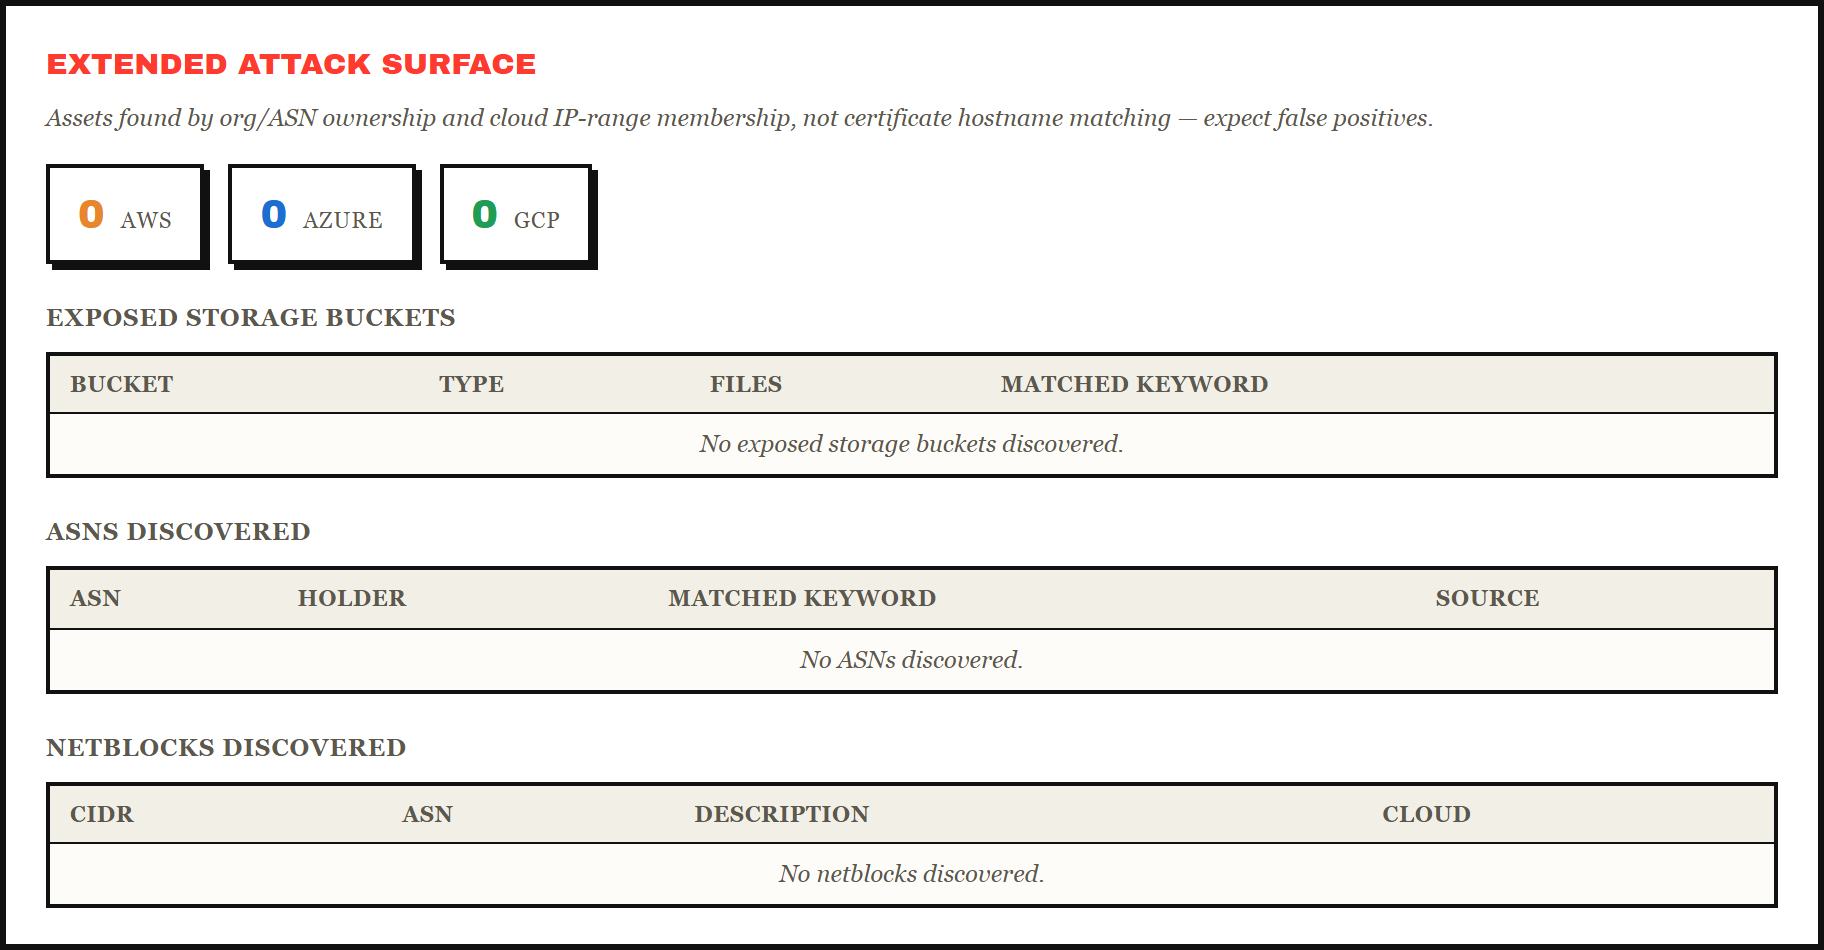
Beyond the graph, this panel shows the Extended Attack Surface module’s structured findings: AWS/Azure/GCP badge counts, exposed storage buckets, discovered ASNs, and discovered netblocks (tagged with cloud provider where applicable). It’s normal for every table here to be empty on a target with no public cloud footprint or BGP-announced infrastructure of its own — that’s a true negative, not a broken panel.
Threat intelligence
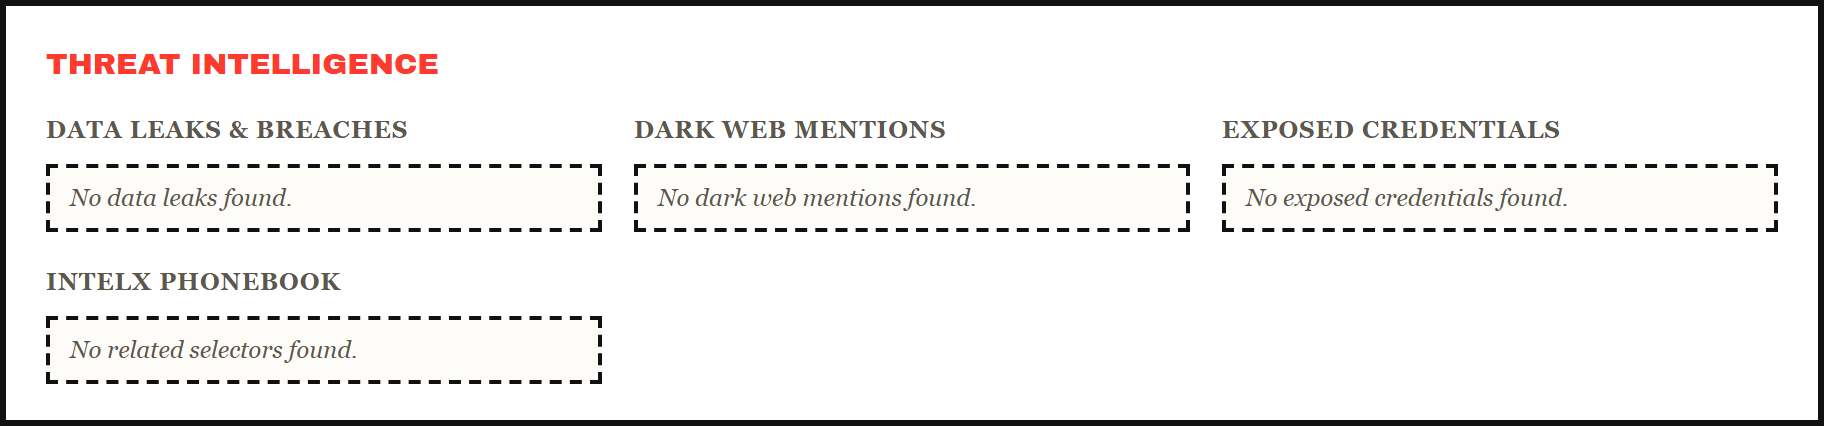
Four columns surface Threat Intelligence’s findings: data leaks & breaches, dark web mentions, exposed credentials, and IntelX phonebook hits.
Typosquat watch
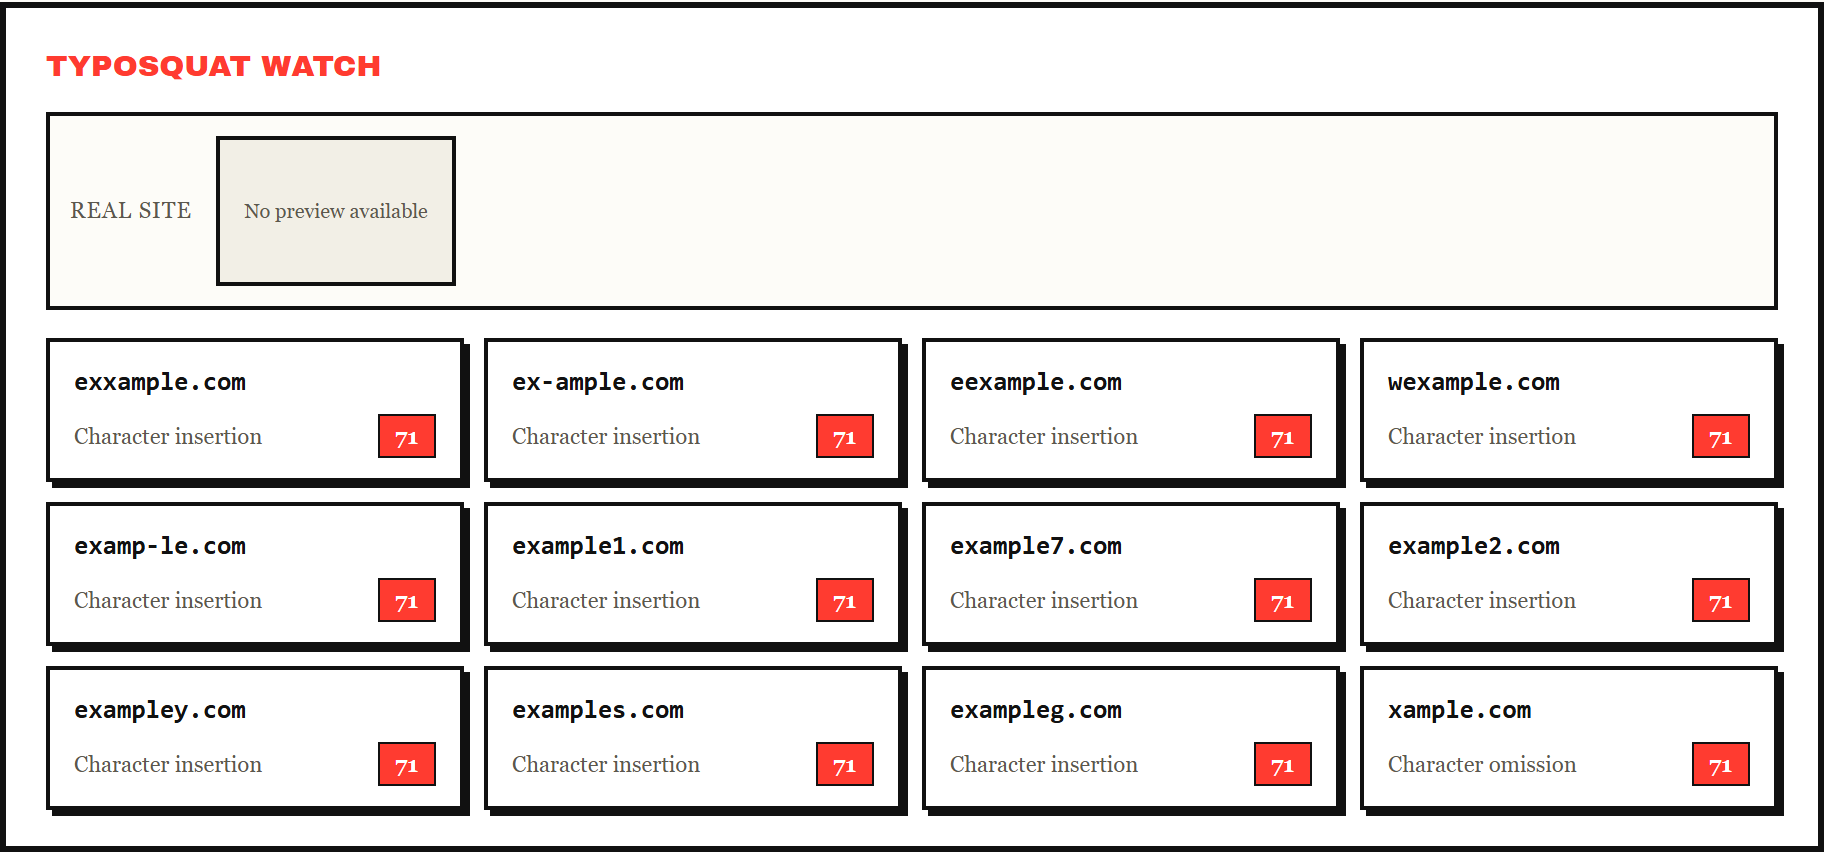
Shows the top 12 active typosquat candidates by risk score, each with its permutation type and score badge. The panel’s HTML includes a side-by-side screenshot comparison modal (real site vs. typosquat, backed by the /api/screenshot?domain= endpoint and a headless-Chromium capture in farsight/web/screenshot.py) — as of this writing, the modal’s click-to-open wiring isn’t connected in app.js, so the comparison view doesn’t currently open from the card grid. The endpoint itself works if called directly.
Report
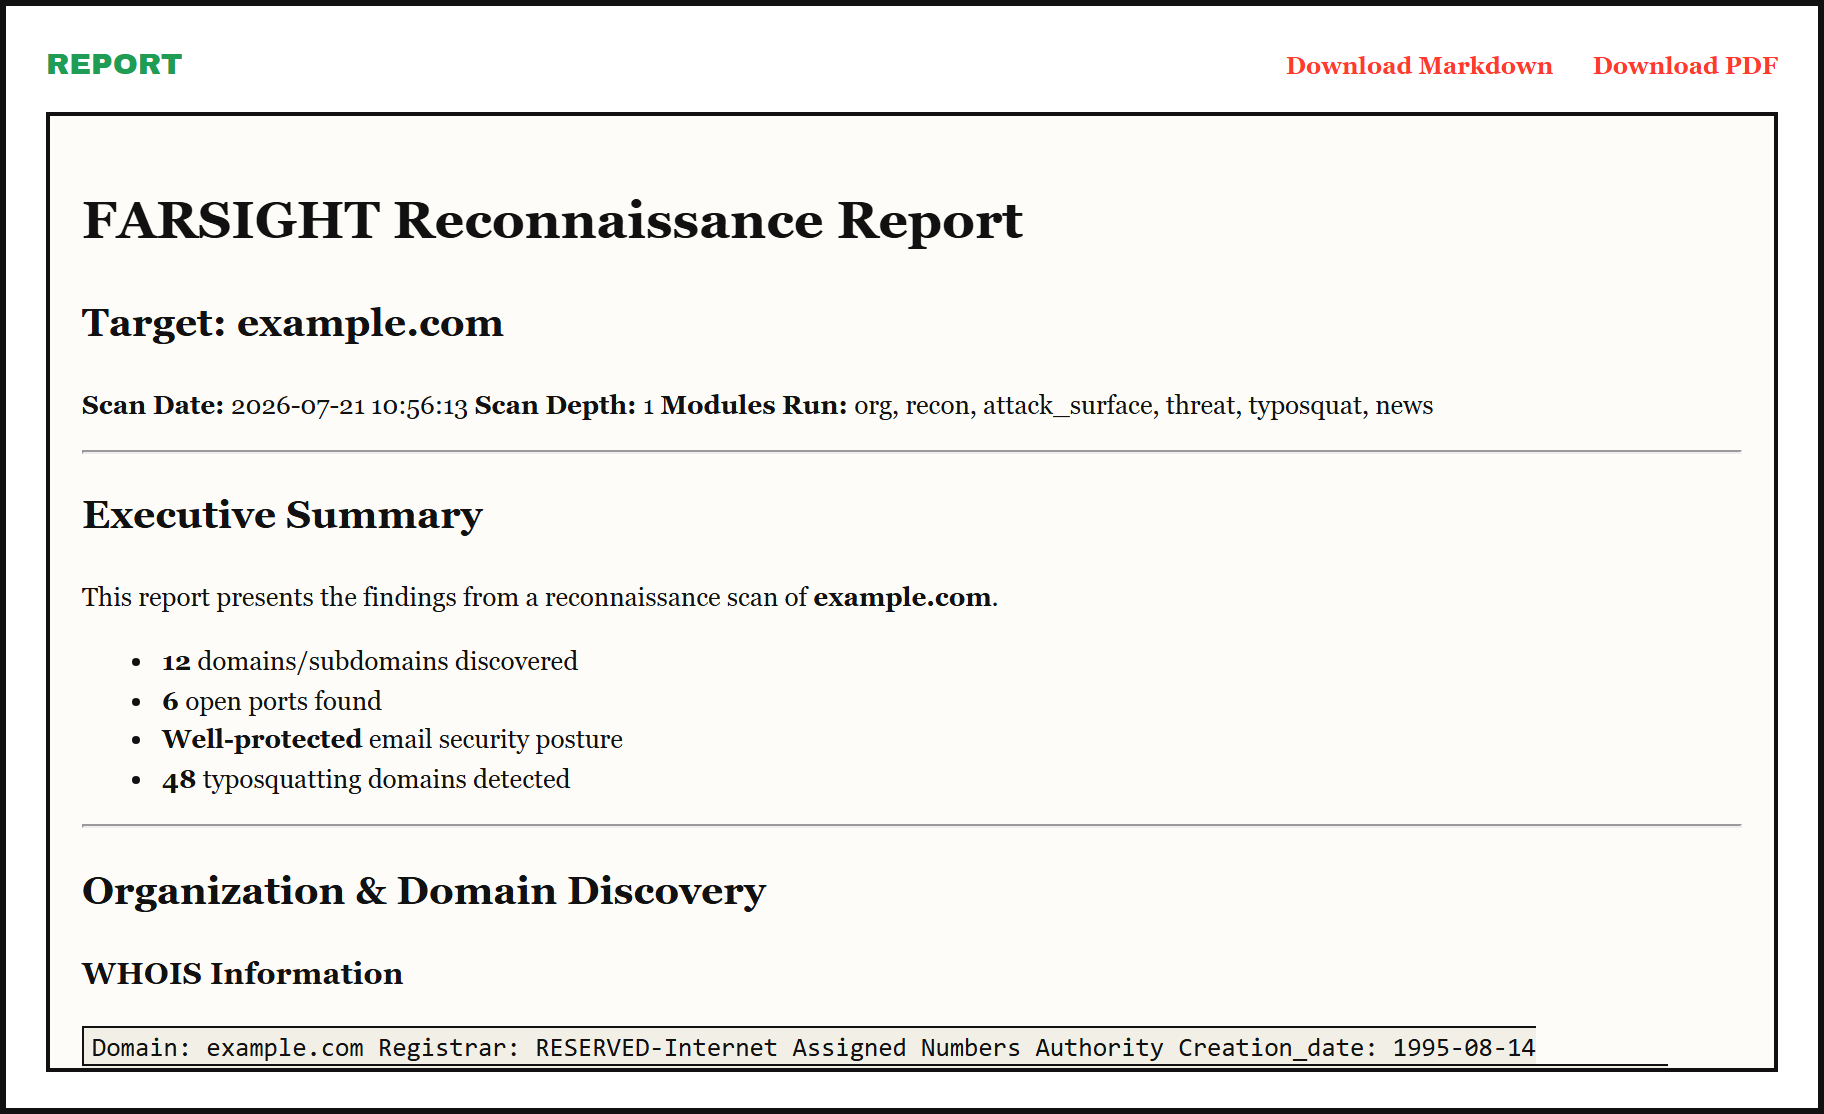
Once report_ready fires, the report panel fetches /api/report/{id}/html (the same Markdown, rendered to HTML with table support) and shows Markdown/PDF download links pointing at /api/report/{id}/download?fmt=md|pdf. See Reports for what the report itself contains.
Demo mode
farsight web --demo replays a captured fixture through the identical event sequence a live scan produces, with no network calls — see Architecture and the CLI Reference for how to use it and capture your own fixture. The bundled fixture predates the Extended Attack Surface module, so demo mode won’t populate that panel — it’s a good demo of everything else.